
![[GROUP BUY] Split60 Extras](http://mtnkbd.com/cdn/shop/files/IMG_3901.jpg?v=1750376156&width=300)
Howdy! It’s been a minute! How are you my long lost friend? Welcome back to another blog. You may have been wondering? Where are those blogs from that small keyboard shop based in Sydney run by that weird man who likes to share his sales analytics?
Okay, let’s be fair, you probably haven’t noticed that I haven’t written anything here in a while. Where have I been? Unfortunately I’ve been busy with other life commitments, like my job. Due to that, the business as a whole has suffered immensely.

The Bad News!
The business isn’t going well.
The Good News!
Business doesn’t have to go well for me to show you financial blogs. I’ve got new updated reporting that I can show you exactly how much money I am losing. Stay tuned!
Alright! I’m catching up on blogs, this one is going to consist of the entire year in review, there will be another one made for 2024 and then we should be back to quarterly releases. Let’s get into it!
Total Sales
For the entire year of 2023 I sold just over $91,000 in goods! This does include taxes, shipping and refunds of orders removed. Looking at this compared to last year’s blog - you’ll notice a 60k drop off in sales. With my crystal ball, I can predict, it does get worse in the future years. This is the start of the decline, limited new products and not enough time to market saw this decrease over the final months of the year.

Sales Breakdown
Here’s a deeper break down of the sales numbers providing an actual gross sales number of just under $85,000. Over $2,200 in discounts and over $5,000 in returns. Shopify provides me an estimate of about $16,000 in gross profit. This comes purely from the cost of goods sold, later we will see exactly how much profit was made for the year once all other expenses Shopify doesn’t track gets taken out.

Payment Type
Here we can see how much of my business goes through PayPal vs direct through Shopify Payments.

Orders Fulfilled

Average Order Value

Sales by Social Referrer
When purchasing an item, Shopify tracks how you were directed to the site. Thank you Reddit!

Sales by Item
Here we can see what items sold the most for me. The Dropbear60 crushing it! I’m typing this blog on mine now.

Sales From Marketing/Referrals

Returning Customer Rate
Here is my returning customer rate. Up almost 10% from last quarter, stoked about this.

Other Stats
Here’s some other stats I thought are interesting if compressed into this blog.


The New Stats! - All Costs + Profits
You’ve seen the above screenshots and analytics before, however, over the last few months I’ve been populating all of my bank statements into a tool called Actual Budget. Allowing me to build out some full reports covering the real analytics. The following screenshots will include all of my costs and payouts from my store. Let’s get into it!
Monthly Net Breakdown
Over the year I made just over $12,000 comparing my expenses to my sales as a whole. About $1,000 a month. Each month had various expenses which you will see shortly. Keep in mind, I have never taken a dollar out of the business but have poured in quite a bit. So this “profit” has just been put into more stock.

Monthly Income by Category
Here we can see my payouts per month by both Shopify Payments and PayPal. This is the direct payouts that I receive once those respective vendors take their cuts (and sometimes returns). This is the raw cash arriving in my account, I then have to pay shipping on top and other expenses - but we’ll get into those nitty gritty details don’t you worry!

Expenses by Category
Oooh boy! Look at this pretty graphs!! I’ve included two in case you prefer donut graphs and wanted to see percentages. Here we can see some details around where exactly my money has been going. Let’s break down some of these categories into individual payees.


Payee - Cost of Goods Sold
Here we can see the vendors or places I purchase goods from. Let’s break down each of these individual Payees.
- “Huizhou” - Gateron reseller, this is where I buy most of my Gateron items
- Keebfront - an American keyboard store - they sold the VG65 keyboard and some switches
- Ancreu - Kailh Choc switch supply (an item I still haven’t put on the store… I’ll get there eventually)
- Guangzhou - a PCB manufacturer - manufactured some EC PCBs
- Keychron - keyboard wholesaler
- Mktn - Kailh Choc keycaps (another item I haven’t listed on the store yet)

Payee - Shipping
Here we can see the shipping paid split between Australia Post and Sendle. Unfortunately the way Sendle is invoiced means that invoiced Shopify apps are also included in this cost.

Payee - Prototyping
Here we’ve got some design royalties being paid alongside some new prototypes being paid for. Let’s break down the other prototyping costs:
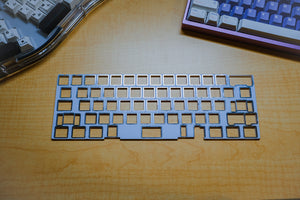
- Sinorise - Split60 prototype
- Yecheng - Split60 prototype

Payee - Taxes (GST) & Freight

Payee - General
Here we’ve got some more generic expenses like my accountant, some meetup costs and other keyboard product purchases.

Payee - Subscriptions & Donations
Here we’ve go subscriptions to accounting, shipping and design software. I also included the donations made to the Foodbank.

Conclusion
There you have it. 2023 analytics done. I don’t know about you, but my smooth brain loves seeing these charts and graphs. Even though I know it is showing my business isn’t in the best state (it gets worse in 2024). I hope you enjoyed reading and seeing all the new updated graphs. The 2024 blog shouldn’t be far off and then I’ll start with Q1 of 2025. I’ll also go back on previous years and show the new graphs for those years too. Anyways! Until the next time - hopefully soon.