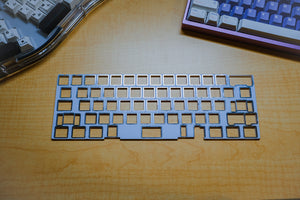

![[GROUP BUY] Split60 Extras](http://mtnkbd.com/cdn/shop/files/IMG_3901.jpg?v=1750376156&width=300)
Ever wonder how much money a custom keyboard store based out of Sydney makes? No? Well this blog will talk about how much I’ve made running my custom keyboard store this quarter. I share these every quarter because I find this side of things fascinating and hopefully you do also. This is the first quarter that I have actual profit percentages I can show.
Total Sales

For the first quarter of this year, I sold a just over $31,500 in goods (note: this includes the shipping, taxes and refunds of orders removed). Comparing this to my figure from the first quarter of 2022, I’ve had an increase in sales. Overall, this is a good sign of growth over the year.
What are those spikes? That was when I listed the Dropbear60 extras (which I still have a few more to list up soon).
Compare that to Q1 of 2022 here

Sales Breakdown

Here’s a deeper break down of the sales numbers providing an actual gross sales number of just under $29,000. Over $600 in discounts is more than the blog a year ago. Overall, positive growth in quarter one this year.
Payment Type

This is a new addition to the blog from last quarter. It shows how people are paying for goods on my store. This shows a reduction of PayPal payments. I removed PayPal during this quarter as they put a limitation on my account and locked me out of funds. I have recently enabled it back after getting that sorted out.
Average Order Value

An average order value of $110 has been one of the lower averages!
Sales by Traffic Source

When purchasing an item, Shopify tracks how you were directed to the site. As far as I know clicking a link from a Discord server counts as a direct traffic source.

Taking a more granular look into social sources.
Returning Customer Rate
Here is my returning customer rate.

Here are the marketing stats.

Other Stats
Here’s some other stats I thought are interesting if compressed into this blog.


Profits!
PSA: This is purely profits on sales of items, not on profits taken out. I am still substantially in the hole in this business as all of the profits you see are reinvested into more product.
This is the first quarter where I have some stats on the profits I’ve made running this business. Most of my items have costs/profits tracked but not all of it unfortunately for this quarter. This quarter has a higher margin compared to normal due to more custom boards selling rather than switches/keycaps.

Conclusion
That concludes the first quarter of 2023 sales analytics. Hopefully that was interesting enough that you’ll want to see future stats. Let’s see where the next quarter goes. Thanks everyone for the support and has enjoyed these blogs. These often fall off the radar for me, but every now and then I’ll chat with someone who asks about these which I love hearing. Until next time!
Much love, 0ldmate