
![[GROUP BUY] Split60 Extras](http://mtnkbd.com/cdn/shop/files/IMG_3901.jpg?v=1750376156&width=300)
Earlier this year I posted a blog on my analytics for each quarter of operating as a business. Here is the final quarter and an overall wrap up of the year. If you wanted to check out the previous blog it’s available here. Unfortunately I only turned on my profit calculations in 2023 so for future blogs, that will show and I’ll show a sneak peak of what that’d look like below.
Total Sales

For the fourth quarter of this year, I sold a just over $18,000 in goods (note: this includes the shipping, taxes and refunds of orders removed). Comparing this to my last blog, it looks like I’ve had quite a decrease in sales which makes sense because a lot of my items were low/out of stock during this quarter. I had a large amount of things sitting in a warehouse in China waiting to be shipped via sea. I was quite greedy and wanted to put everything in that sea shipment to save on costs, when realistically it probably would have been better to pay the extra cost and have more stock over the xmas period. I had a new keyboard being produced that I pre-sold last quarter and wanted wait for that before I shipped it all over. One thing I forgot to mention in previous blog posts is this data is comparing itself to the quarter before so there was a 71% decrease in sales this quarter, but that was just because last quarter was an anomaly and because of reasons mentioned above.
Sales Breakdown

Here’s a deeper break down of the sales numbers providing an actual gross sales number of just under $17,000. Over $500 in discounts is less than the last blog. My returns (refunds) are still quite high due to a lot of people FOMOing into the DropBear60 and then getting cold feet. Overall, a substanially smaller quarter to finish off the year.
Payment Type

This is a new addition to the blog from last quarter. It shows how people are paying for goods on my store. This shows a substantial increase of paypal payments (percentage wise). Which is a shame because of how PayPal operates for businesses. So far, I’ve not had any issues so it will remain an option on the store.
Average Order Value

An average order value of $80 has been one of the lower averages!
Sales by Traffic Source

When purchasing an item, Shopify tracks how you were directed to the site. As far as I know clicking a link from a Discord server counts as a direct traffic source.

Taking a more granular look into social sources.
Returning Customer Rate
Here is my returning customer rate. Up almost 10% from last quarter, stoked about this.

Here are the marketing stats, this should be a mix between emails and my Loox reviews app.

Other Stats
Here’s some other stats I thought are interesting if compressed into this blog.


That’s the stats for the quarter. Let’s take a look at the year as a whole now!
2022 Analytics
2022 was the first full year of operation of my store. What a wild year. What started as an interest in a hobby 7 years ago turned into me designing my own keyboard turned into running this business. Let’s take a look into how the year went as a whole.
Total Sales

For 2022, I sold just over $150,000 in goods (note: this includes the shipping, taxes and refunds of orders removed). I’m pretty stoked with that, considering I run this out of my house. Though I do want to express this takes a huge amount of effort to run. Packing orders takes longer than you’d think.. At least, what I thought anyways.
Sales Breakdown

Here’s a deeper break down of the sales numbers providing an actual gross sales number of just under $140,000.
Payment Type

Here’s a break down of the payments. Overall, I imagine PayPal payments in 2023 will grow if it still remains on the store.
Average Order Value
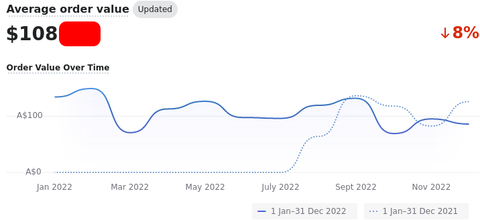
An average order value of $108 for the year isn’t bad. Hopefully this will go up next year.
Sales by Traffic Source

When purchasing an item, Shopify tracks how you were directed to the site. Thanks to discord for being a huge source of traffic sales. Thanks yo!

Taking a more granular look into social sources. Reddit and Facebook really helping me out.
Returning Customer Rate
Here is my returning customer rate.

Here are the marketing stats for 2022, this should be a mix between emails and my Loox reviews app.

Here is the retail sales from the keyboard meet up last year.

Other Stats
Here’s some other stats I thought are interesting if compressed into this blog. Thanks to everyone who has referred my website in 2022.


Conclusion
That’s the 2022 sales analytics. What a year. I am surprised we hit $150,000, I had a goal of $100,000 so I’m glad to have beat that goal by an extra $50,000. Thank you to everyone who has supported the store, read these blogs or has taken an interest in keyboards through this content. I’m glad I’ve been able to share these stats and figures around my store. I’m still a small fish in the keyboard space and one day I’d hope to see some other store figures in this space. Now that a recession is imminent, it’ll be interesting to see how the store goes when there’s no longer money flowing like it has previously. Next quarter will have the details of profits I’ve made on the store. Here’s a sample of what that’ll look like.

Hopefully in 2023 I’ll be able to write up some more blogs on the specifics of profits, the cost of manufacturing a keyboard and I may even do a blog similar to my Elastic Cash blog on the business to see where the money was spent. Stay tuned.